Point of Success Dashboard
The Dashboard gives you access to a variety of financial information from your restaurant. Dashboard works with Point of Success restaurant point of sale software and gives you current operational information anywhere at any time. Key people can be out of the restaurant but they’re never out of touch!

Here’s the financial information available in the Dashboard:
- Hourly Sales: Sales by hour with totals by hour and location. Supports multiple locations.
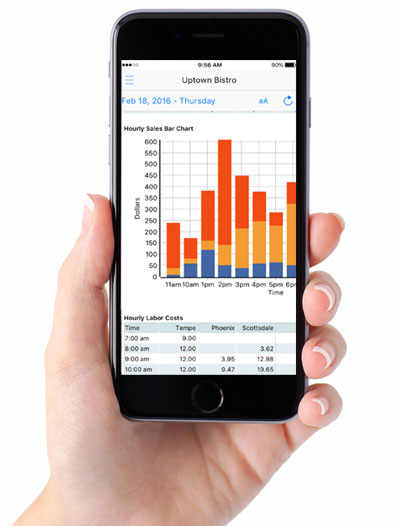
- Hourly Labor Costs: Hourly estimate of labor cost for hourly clocked in employees. Supports multiple locations.
- Hourly Order Count: Count of completed orders by hour. Supports multiple locations.
- Sales Detail – Week to Date: Net sales, order count, average ticket, number of voided orders, discount and discount percentage. Supports multiple locations.
- Sales Detail – Month to Date: Net sales, order count, average ticket, number of voided orders, discount and discount percentage. Supports multiple locations.
- Historic Data – Last Week: Net sales last week, variance of weekly sales during the same week last year, order count, last year variance, average ticket last week and variance from last year. Supports multiple locations.
- Historic Data – Last Month: Net sales last month, variance of monthly sales during the same month last year, order count, last year variance, average ticket last month and variance from last year. Supports multiple locations.
- Product Sales by Category: Total sales by product category for yesterday, last week and last month. Supports one store per panel.
- Hourly Sales Line Graph: Hourly sales represented in a line graph. Supports multiple stores.
- Labor Cost Line Graph: Labor cost line graph by hour for hourly clocked in employees. Supports miltiple locations.
- Sales Chart – Week to Date: Week to date sales in a pie chart. Supports multiple stores for comparison.
- Sales Chart – Month to Date: Month to date sales in a pie chart. Supports multiple stores for comparison.
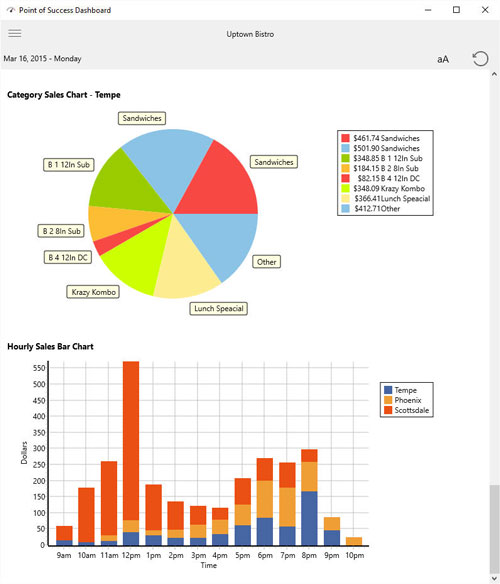
- Category Sales Chart: Pie chart of total sales by product category for one location. Set up a panel for each store.
- Hourly Sales Bar Chart: Stacked bar chart for sales by hour of the day. Supports multiple locations.

Above is the desktop dashboard client software for Windows
Where Can You Use the Dashboard?
A program running on the Point of Success server computer sends financial data to the Dashboard cloud server every ten minutes.
The Dashboard Client software lets you see restaurant financial details stored on the cloud server. The Dashboard client software is available for these platforms:
- Windows desktop, laptop or Surface Pro tablet (Windows 7 or above required)
- Mac desktop or notebook
- iPhone and iPad (iOS version 9 or above recommended)
Customize and Personalize
Dashboard works with one restaurant location or for many locations. Design user accounts to show just the information needed by or permitted to be seen by each user. Set up dashboards for store managers, regional managers or owners and control the information and locations accessible to them.
Cloud Data
Data is synchronized every ten minutes between Point of Success POS software at each restaurant location and the cloud server, keeping your dashboard current. Notifications in the Dashboard tell you if a location has missed a sync window.
Point of Success Dashboard requires the use of Point of Success restaurant point of sale software at each restaurant location. Requires an always-on Internet connection at each restaurant location and an Internet connection for the client device when in use.